PAN-OS CLI Commands
show chassis inventory
show netstat route yes
show transceiver all
show system info
show system info | match serial
show high-availability state
show high-availability state | match State
show interface management
Advance Troubleshooting and Maintenance Commands
show routing route
show routing route virtual-router default
ping source 10.1.1.1 host 8.8.8.8
traceroute host 8.8.8.8
Global Counters
ping source (Dataplane Zone Interface ip) host (Destination IP address within the Zone)
ping source 203.0.113.20 host 8.8.8.8
debug dataplane packet-diag show setting
debug dataplane packet-diag clear filter index all
Show counter global filter packet-filter yes delta yes
Set Filters now
> debug dataplane packet-diag set filter index 1 match source 10.1.2.200/32 destination 10.2.2.101/32 destination-port 80 ingress-interface ethernet1/2 protocol 6> debug dataplane packet-diag set filter index 2 match source 10.2.2.101/32 destination 10.1.2.200/32 source-port 80 ingress-interface ethernet1/3 protocol 6
Now you will have to set the filter on
> debug dataplane packet-diag set filter on
Verify Filter is set
> debug dataplane packet-diag show setting
> debug dataplane packet-diag set filter on
Verify Filter is set
> debug dataplane packet-diag show setting
> show counter global filter severity drop
> show counter global filter delta yes severity drop
> show counter management-server
> show counter interface management
> show counter interface tunnel.51
> show counter global filter aspect arp
> show counter global name
tail follow yes mp-log ms.log
debug dataplane pool statistics
show running resource-monitor
set cli config-output-format
show jobs all
reset sessions all
show config running
configure
set deviceconfig system
show system resources follow
watch admin sessions
show global-counter
clear config session
request chassis locate
commit validate
admin@MYFW02(active)>
debug software restart process management-server (restarts management plain only)
admin@MYFW02(active)>
admin@MYFW02(active)>configure
Entering configuration mode
[edit]
admin@MYFW02(active)#
admin@MYFW02(active)# show deviceconfig
admin@my-fw101> show system info | match serial
serial: 026909003344
set cli config-output-format set
configure
set deviceconfig system ip-address 10.113.4.95
commit
configure
set deviceconfig system ip-address 10.113.4.95
commit
> show system info
> show advanced-routing route
> show interface
> show interface ethernet1/6
> show counter global
> show high-availability cluster all
> show advanced-routing route
> show interface
> show interface ethernet1/6
> show counter global
> show high-availability cluster all
Palo Alto Firewall Commands:
show system info
show system resource
show session info
show interface management
show arp all
show interface all
show interface ethernet1/1
show config run
show config candidate
show session all
show routing route
show routing route virtual-router default
show log system
show log traffic
ping source 10.1.1.1 host 8.8.8.8
traceroute host 8.8.8.8
show admins
clear session all
show high-availability state
Configuraiton Commands
set
delete
edit
set deviceconfig system ip-address x.x.x.x (sets firewall IP address)
delete license key *.key (removes all licenses)
edit
Example of CLI
admin@MYFW02(active)> set cli config-output-format set
admin@MYFW02(active)>configure
admin@MYFW02(active)# set deviceconfig system ip-address 10.13.14.95
set deviceconfig system dns-setting servers primary 16.18.76.16
set deviceconfig system dns-setting servers secondary 8.8.8.8
set deviceconfig system timezone US/Eastern
set deviceconfig system login-banner "Unauthorized access is prohibited. ^M All activity may be monitored."
commit
admin@MYFW02(active)#
admin@MYFW02(active)# show deviceconfig
admin@MYFW02(active)# quit
Exiting configuration mode
admin@MYFW02(active)>
ping source (Dataplane Zone Interface ip) host (Destination IP address within the Zone)
ping source 203.0.113.20 host 8.8.8.8
Global Counters
- Filter
- Global Counter
- Delta
View Filter created from GUI (Note you will have to create 2 filters one for outgoing and other for incoming
> debug dataplane packet-diag clear filter index all
(This command Clear all filters)
Verify All debug packet filters deleted
> debug dataplane packet-diag show setting
more than 256 counters
>Show counter global
>Show counter global filter packet-filter yes delta yes
Verify All debug packet filters deleted
> debug dataplane packet-diag show setting
more than 256 counters
>Show counter global
- Increase Counter when packet passes thru it such as dropped, NAT-ed, decrypted etc.
- Counters useful for troubleshooting poor performance, packet lost, latency etc
- Severity level for each counter include: Warn, Info, error and Drop
- Use Counter with filters to obtain meaningful data
>Show counter global filter packet-filter yes delta yes
(give you a snapshot of the counter that incremented since last Show counter global Packet drop by the firewall. To troubleshoot dropped packets
>show counter global filter severity drop
>Show counter global filter packet-filter yes delta yes
reproduce issue
>Show counter global filter packet-filter yes delta yes
reproduce issue
>Show counter global filter packet-filter yes delta yes
narrow specific traffic at a specific time
>Show counter global filter packet-filter yes delta yes
> debug dataplane packet-diag set filter index 1 match source 10.1.2.200/32 destination 10.2.2.101/32 destination-port 80 ingress-interface ethernet1/2 protocol 6
> debug dataplane packet-diag set filter index 2 match source 10.2.2.101/32 destination 10.1.2.200/32 source-port 80 ingress-interface ethernet1/3 protocol 6
Now you will have to set the filter on
> debug dataplane packet-diag set filter on
Verify Filter is set
> debug dataplane packet-diag show setting
>test routing fib-lookup virtual-route VR-01 IP "192.168.1.1'
admin@MYFW02(passive)> debug dataplane packet-diag show setting
--------------------------------------------------------------------------------
Packet diagnosis setting:
--------------------------------------------------------------------------------
Packet filter
Enabled: yes
Match pre-parsed packet: no
Filter offload: yes
Index 1: 100.20.59.148/32[0]->0.0.0.0/0[0], proto 0
ingress-interface any, egress-interface any, exclude non-IP
Index 2: 0.0.0.0/0[0]->100.20.59.148/32[0], proto 0
ingress-interface any, egress-interface any, exclude non-IP
--------------------------------------------------------------------------------
Logging
Enabled: no
Log-throttle: no
Sync-log-by-ticks: yes
Features:
Counters:
Timeout duration: 60 seconds
Buffer threshold: 80%
CPU threshold: 80%
--------------------------------------------------------------------------------
Packet capture
Enabled: no
Snaplen: 0
Username:
Stage receive : file rec
Captured: packets - 9 bytes - 594
Maximum: packets - 0 bytes - 0
Stage firewall : file fwlog
Captured: packets - 9 bytes - 594
Maximum: packets - 0 bytes - 0
Stage transmit : file tran
Captured: packets - 0 bytes - 0
Maximum: packets - 0 bytes - 0
Stage drop : file drop
Captured: packets - 0 bytes - 0
Maximum: packets - 0 bytes - 0
--------------------------------------------------------------------------------
admin@MYFW02(passive)>
Packet Capture Filters


>debug dataplane packet-diag set log feature

To set packet capture filters on a Palo Alto firewall, navigate to Monitor > Packet Capture, then select Manage Filters and create a filter by specifying source and destination IPs, applications, or other criteria. Next, define the traffic stages (e.g., receive, transmit, firewall) to capture and a filename for each. Finally, turn on filtering and then start the packet capture to begin collecting data based on your defined filters.
Steps to set filters in the GUI:
- In the firewall's graphical user interface (GUI), go to Monitor > Packet Capture.
- Click on Manage Filters to configure your capture criteria.
- Name: Give your filter a descriptive name.
- Filter Criteria: Specify the traffic you want to capture. You can use:
- IP Addresses: Enter source and/or destination IP addresses, or use
0.0.0.0for all traffic from a source or to a destination. - Application Name: Target specific applications.
- Interface: Specify the interface for the capture.
- Ports: You can also specify ports for more granular filtering.
- IP Addresses: Enter source and/or destination IP addresses, or use
- Name: Give your filter a descriptive name.
- Go back to the main Packet Capture page.
- For each stage you want to capture (e.g., receive, firewall, transmit, drop), add it to the configuration and provide a unique File name for the resulting capture file.
- Go back to the main Packet Capture page.
- Turn on filtering: by clicking the filtering button.
- Turn on the packet capture: itself to begin the process.
- Turn on filtering: by clicking the filtering button.
Important Considerations:
- Packet captures on Palo Alto firewalls are stateful, meaning that if you specify the source and destination for a session, the return traffic is automatically captured as well.
- Filters are crucial for preventing excessive resource usage and potential performance degradation or firewall crashes.
- To stop the capture, first turn off the packet capture, then turn off filtering.
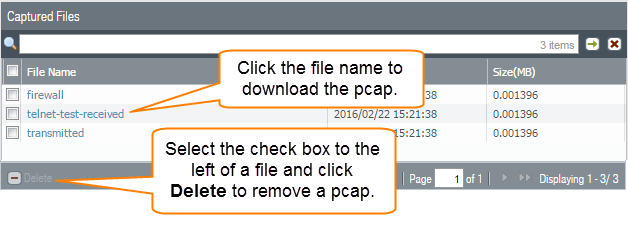
- Captured files are displayed on the right side of the interface and can be downloaded for analysis using a network packet analyzer like Wireshark.
Custom packet captures allow you to define the traffic that the Next-Generation Firewall will capture. To ensure that you capture all traffic, you may need to Disable Hardware Offload.
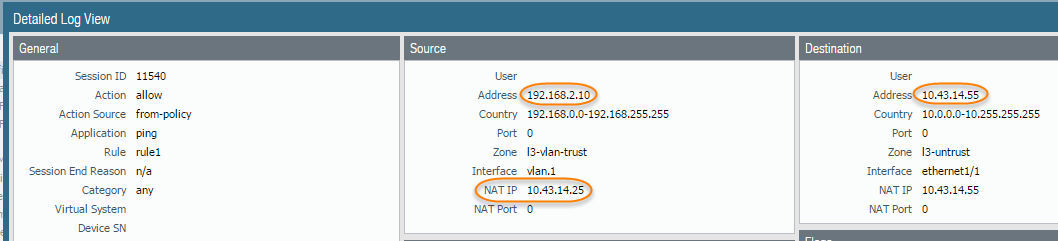
- Before you start a packet capture, identify the attributes of the traffic that you want to capture.For example, to determine the source IP address, source NAT IP address, and the destination IP address for traffic between two systems, perform a ping from the source system to the to the destination system. After the ping is complete, go to and locate the traffic log for the two systems. Click the Detailed Log View icon located in the first column of the log and note the source address, source NAT IP, and the destination address.The following example shows how to use a packet capture to troubleshoot a Telnet connectivity issue from a user in the Trust zone to a server in the DMZ zone.
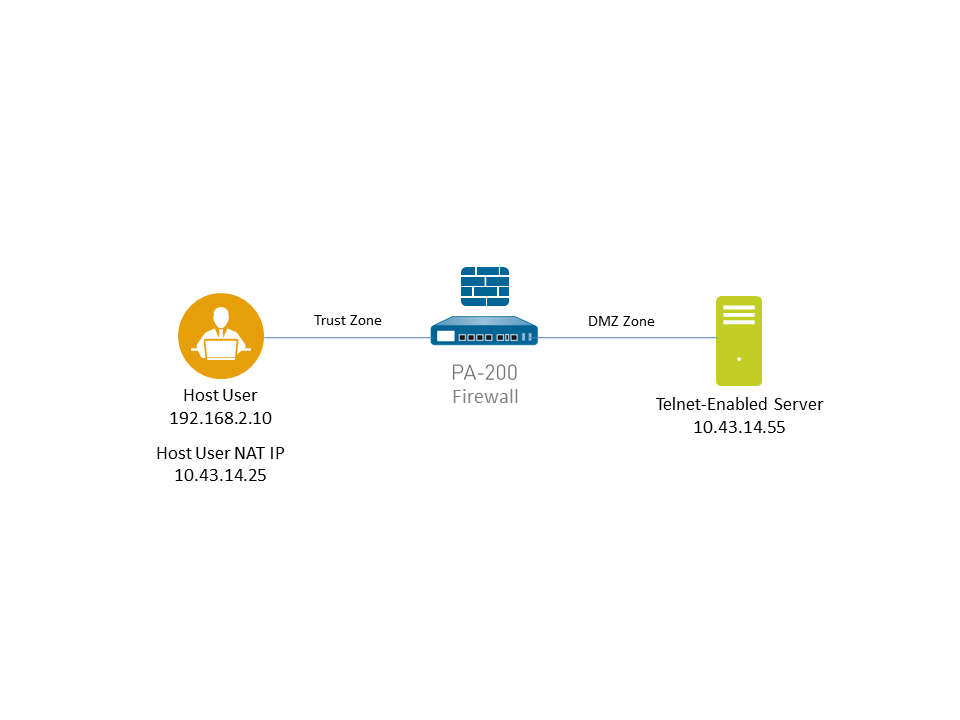
- Set packet capture filters, so the Next-Generation Firewall only captures traffic you are interested in.Using filters makes it easier for you to locate the information you need in the packet capture and will reduce the processing power required by the Next-Generation Firewall to take the packet capture. To capture all traffic, do not define filters and leave the filter option off.For example, if you configured NAT on the Next-Generation Firewall, you will need to apply two filters. The first one filters on the pre-NAT source IP address to the destination IP address and the second one filters traffic from the destination server to the source NAT IP address.
- Select .
- Click Clear All Settings at the bottom of the window to clear any existing capture settings.
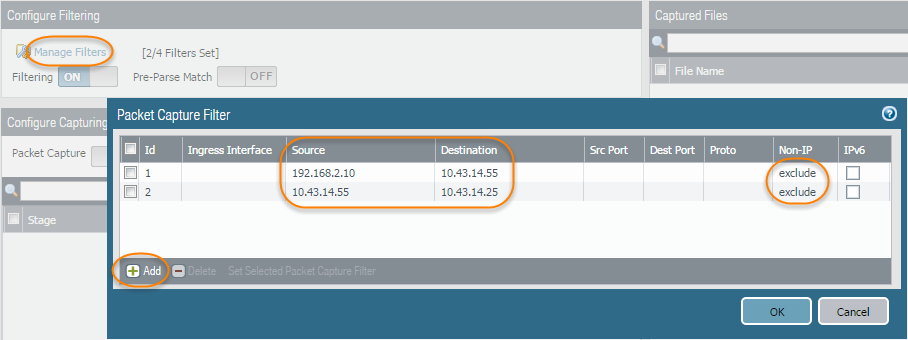
- Click Manage Filters and click Add.
- Select Id 1 and in the Source field enter the source IP address you are interested in and in the Destination field enter a destination IP address.For example, enter the source IP address 192.168.2.10 and the destination IP address 10.43.14.55.(12.1.2 and later releases) You can enter a source IP address range and a destination IP address range to capture traffic within the specified range. Use dash delimiters to separate the range of values. For example, enter the source IP address range 192.168.2.10-192.168.2.20 and the destination IP address range 10.43.14.55-10.43.14.65.To further filter the capture, set Non-IP to exclude non-IP traffic, such as broadcast traffic.
- Add the second filter and select Id 2.For example, in the Source field enter 10.43.14.55 and in the Destination field enter 10.43.14.25. In the Non-IP drop-down menu select exclude.
- Click OK.
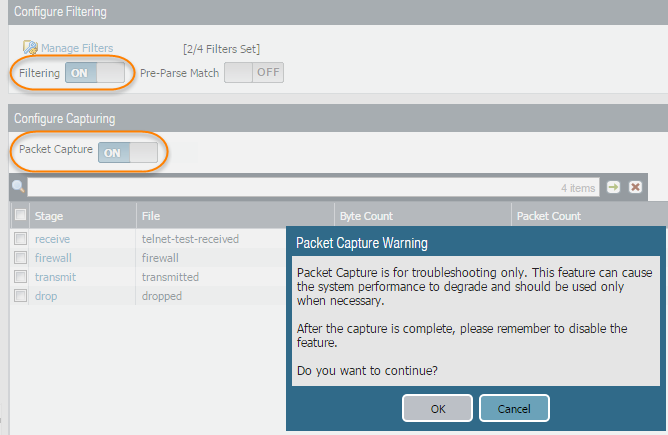
- Set Filtering to On.
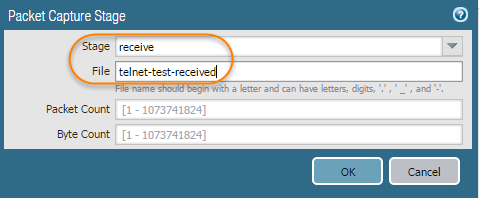
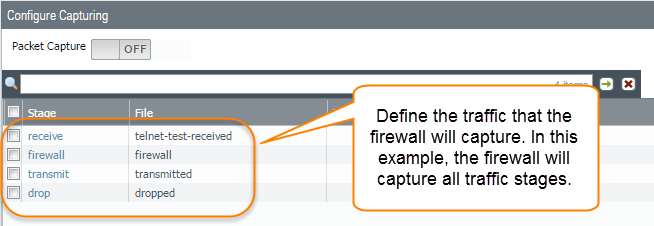
- Specify the traffic stage(s) that trigger the packet capture and the filename(s) to use to store the captured content. For a definition of each stage, click the Help icon on the packet capture page.For example, to configure all packet capture stages and define a filename for each stage, perform the following procedure:
- Add a Stage to the packet capture configuration and define a File name for the resulting packet capture.For example, select receive as the Stage and set the File name to telnet-test-received.
- Continue to Add each Stage you want to capture (receive, firewall, transmit, and drop) and set a unique File name for each stage.
- Set Packet Capture to ON.The Next-Generation Firewall or appliance warns you that system performance can be degraded; acknowledge the warning by clicking OK. If you define filters, the packet capture should have little impact on performance, but you should always turn Off packet capture after the Next-Generation Firewall captures the data that you want to analyze.
- Generate traffic that matches the filters that you defined.For this example, generate traffic from the source system to the Telnet-enabled server by running the following command from the source system (192.168.2.10):telnet 10.43.14.55
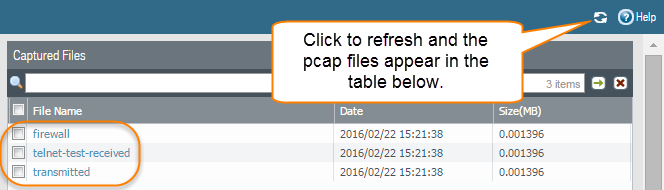
- Turn packet capture OFF and then click the refresh icon to see the packet capture files.Notice that in this case, there were no dropped packets, so the Next-Generation Firewall did not create a file for the drop stage.
- Download the packet captures by clicking the filename in the File Name column.
- View the packet capture files using a network packet analyzer.In this example, the received.pcap packet capture shows a failed Telnet session from the source system at 192.168.2.10 to the Telnet-enabled server at 10.43.14.55. The source system sent the Telnet request to the server, but the server did not respond. In this example, the server may not have Telnet enabled, so check the server.
- Enable the Telnet service on the destination server (10.43.14.55) and turn on packet capture to take a new packet capture.
- Generate traffic that will trigger the packet capture.Run the Telnet session again from the source system to the Telnet-enabled servertelnet 10.43.14.55
- Download and open the received.pcap file and view it using a network packet analyzer.The following packet capture now shows a successful Telnet session from the host user at 192.168.2.10 to the Telnet-enabled server at 10.43.14.55.


No comments:
Post a Comment